Tutorial - Clustering
Please find the associated IPython notebook here
Clustering
In this notebook, we shall see how clustering can be used, and when it does learn interesting shapes and when it doesn’t.
K Means clustering
In Kmeans clustering, our aim is simply to generate cluster IDs for every point in the data set. Remember, our choice of K is something that needs to be picked carefully. Different K’s could give drastically different “clustering” performances.
# Import the libraries first
import numpy as np
import matplotlib.pyplot as plt

# Import the KMeans algorithm from sklearn
from sklearn.cluster import KMeans
# Import an easy way to create our random data
from sklearn.datasets import make_blobs
# Generate 500 random samples in 2D space
# The parameter "centers" reflect how many "blobs" are there in the data
X, y = make_blobs(n_samples = 500, n_features = 2, centers = 4)
print(X.shape)
print(np.bincount(y))(500, 2)
[125 125 125 125]# Plot the original blobs
plt.scatter(X[:,0], X[:,1], c=y)
plt.show()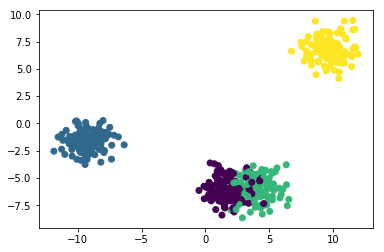
Generated Image
# Now we try doing our KMeans clustering. One way would be to call "fit" and then call "predict"
kmean =KMeans(n_clusters = 2).fit(X)
ids = kmean.predict(X)
# Another method is to directly call fit_predict, if we wish to cluster the training data itself.
ids = KMeans(n_clusters = 5).fit_predict(X)# Plot the learned clusters
plt.scatter(X[:,0], X[:,1], c=ids)
plt.show()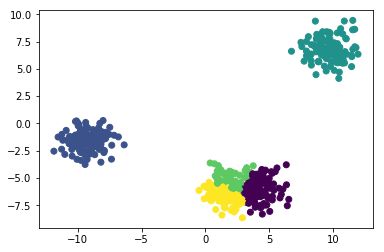
Generated Image
Gaussian Mixture Models
In this section, we will try and see what GMMs do. They will perform similar to the earlier example, hopefully!
# Import the GMM module from sklearn
from sklearn.mixture import GaussianMixture
# We will work with our earlier data itself, we could use make_blob to generate new data as well
# When we learn a mixture of gaussians, we actually have an additional flexibility : what shape should the Gaussians be?
# Please do review gaussian distributions and find out what these options are!
gmm = GaussianMixture(n_components = 2, covariance_type="full").fit(X)# Predict what the clusters will be for X
ids = gmm.predict(X)# Plot the learned clusters
plt.scatter(X[:,0], X[:,1], c=ids)
plt.show()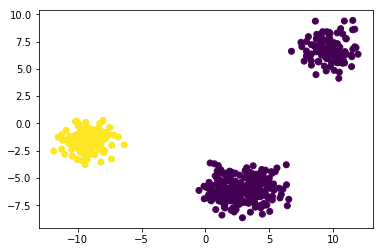
Generated Image
I hope this illustrates what the use of clustering can be! Feel free to play around with the different parameters and settings, and see what sort of clustering is generated. We can even use absolutely random data, and try to cluster it! I have used the make_blob method just for convenience.