Programming Assignment 2
Please find the associated IPython notebook here.
Linear Regression
In this notebook, we shall explore the use of gradient descent as well as stochastic gradient descent. The problem we will tackle is very simple, we will work with 1D linear regression. We have a bunch of points X, and each point is associated with a value Y. Our goal is to model Y = mX, find the unknown m, and when given a new point, predict using this m.
Let us first remember what our loss function, and the associated gradient would be:
\(L(m) = \sum (y_i - mx_i)^2\) \(g(m) = -2\sum x_i (y_i - mx_i)\)
And our stochastic gradient would then be \(sg(m) = -2 x_i(y_i - mx_i)\)
Let us start, by first generating our data. We will generate a random bunch of points for X, Y.
import numpy as np
import matplotlib.pyplot as plt
We are going to generate 50 random points between 0, 100. Then, we will transform these points as X -> 5X. And finally, to obtain our Y, we will add some noise onto these values, to generate Y = 5X + noise.
# Generate points from a uniform distribution
X = np.random.uniform(0, 100, 100)
# Generate some errors to add to the final points
errors = np.random.normal(0,1,100)
# This is the model that we would like to learn
mstar = 5
# Generate the values of each point
Y = mstar * X + errors
# Hopefully, these points all lie on a line!
plt.scatter(X, Y)
plt.show()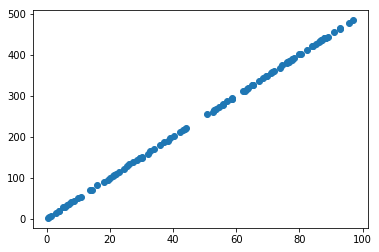
image
We will run both gd and sgd to find the optimal value of m.
Let us start with some random guess for m
# Initialize values of m for gd and sgd
m_sgd = 10
m_gd = 8
# Let's see what these look like compared to our data points
plt.scatter(X, m_sgd*X, color='r', label="SGD line")
plt.scatter(X, m_gd*X, color='g', label="GD line")
plt.scatter(X, Y, color='yellow', label="True data")
plt.legend()
plt.show()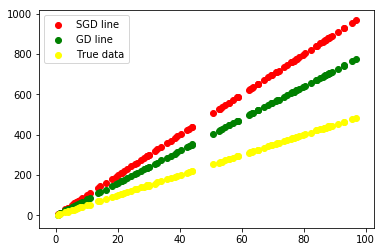
image
As you may have noticed, both the SGD and GD model are off. Additionally, the yellow (data) is not exactly on a line, whereas the other two are exact lines.
Now, we shall define two functions that calculates the value of the gradient for particular value of w, and also computes the “stochastic” gradient at a point, and value of w. (Note I use w and m interchangeably, w is the general notation for “parameter” and for us, the parameter is the slope, usually denoted by m)
def gradient(w, X, Y):
    grad = 0
    for i in range(X.shape[0]):
        delta = Y[i] - X[i]*w
        grad = grad  + -2*X[i]*delta
    return grad/X.shape[0]
def sgradient(w, X, Y):
delta = Y - X*w
grad = -2*X*delta
return gradLet us try one iteration of both gradient descent as well as sgd. Remember, the formula for gd is \(w^{t+1} = w^{t} - \eta*g(w^{t})\), and for sgd, we simply replace \(g(w^t)\) with the stochastic gradient
# Generate a random number to compute SGD with. Remember, we take random points!
eta = 0.00001
i = np.random.randint(0, X.shape[0])
m_gd = m_gd - eta*gradient(m_gd, X, Y)
m_sgd = m_sgd - eta *sgradient(m_sgd, X[i], Y[i])
We have done one update, let us now plot the points and see!
for i in range(500):
    m_gd = m_gd - eta*gradient(m_gd, X, Y)
    i = np.random.randint(0, X.shape[0])
m_sgd = m_sgd - eta*sgradient(m_sgd, X[i], Y[i])print(m_sgd)
print(m_gd)5.00112746964
4.99914942999We can see what the final predicted slope is. Notice that it is not exactly the value that we would have liked (5), but it is pretty close.
Actual Assignment Part
In this assignment, you will have to set up a loss function to find the “closest” point to a set of points. I will generate the set of points, but following the procedure above, you will have to write your own SGD and GD optimizers, and arrive at the final solution.
# Initialize the dataset
# Obtain 100 points between 0,100
X = np.random.uniform(0, 100, 100)
plt.plot(X)
plt.show()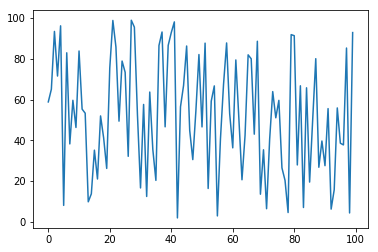
Image
def GD(x, X):
    gradient = 0

    # Fill in this part!

    return gradient

def SGD(x, X):
    gradient = 0

    # FIll in this part!

    return gradient
# Initialize values of eta, closest points (Denoted by x_sgd, x_gd)
eta = 0.01
# Iterate and optimize!
for i in range(500):
x_gd = x_gd - eta*GD(x_gd, X)
i = np.random.randint(0, X.shape[0])
x_sgd = x_sgd - eta*SGD(x_sgd, X[i])# Let's print and see what the values we obtained are!
print(x_gd)
print(x_sgd)
print(X.mean())